
Introduction: A Clear Line Between Hype and Working Megawatts
I’ll start plain: results beat promises, every time. In my 20+ years sizing and buying big batteries for utilities and EPC firms, I’ve watched good projects sing and bad ones stall in the heat. Utility scale battery storage sits right in the middle of that divide. Early on, I learned that the fastest way to separate noise from value is to compare how real vendors behave under pressure—grid pressure, budget pressure, and weather pressure (the kind you feel in your bones after a July outage test). If you’re weighing utility scale battery storage companies, you need evidence in hours and cycles, not adjectives.
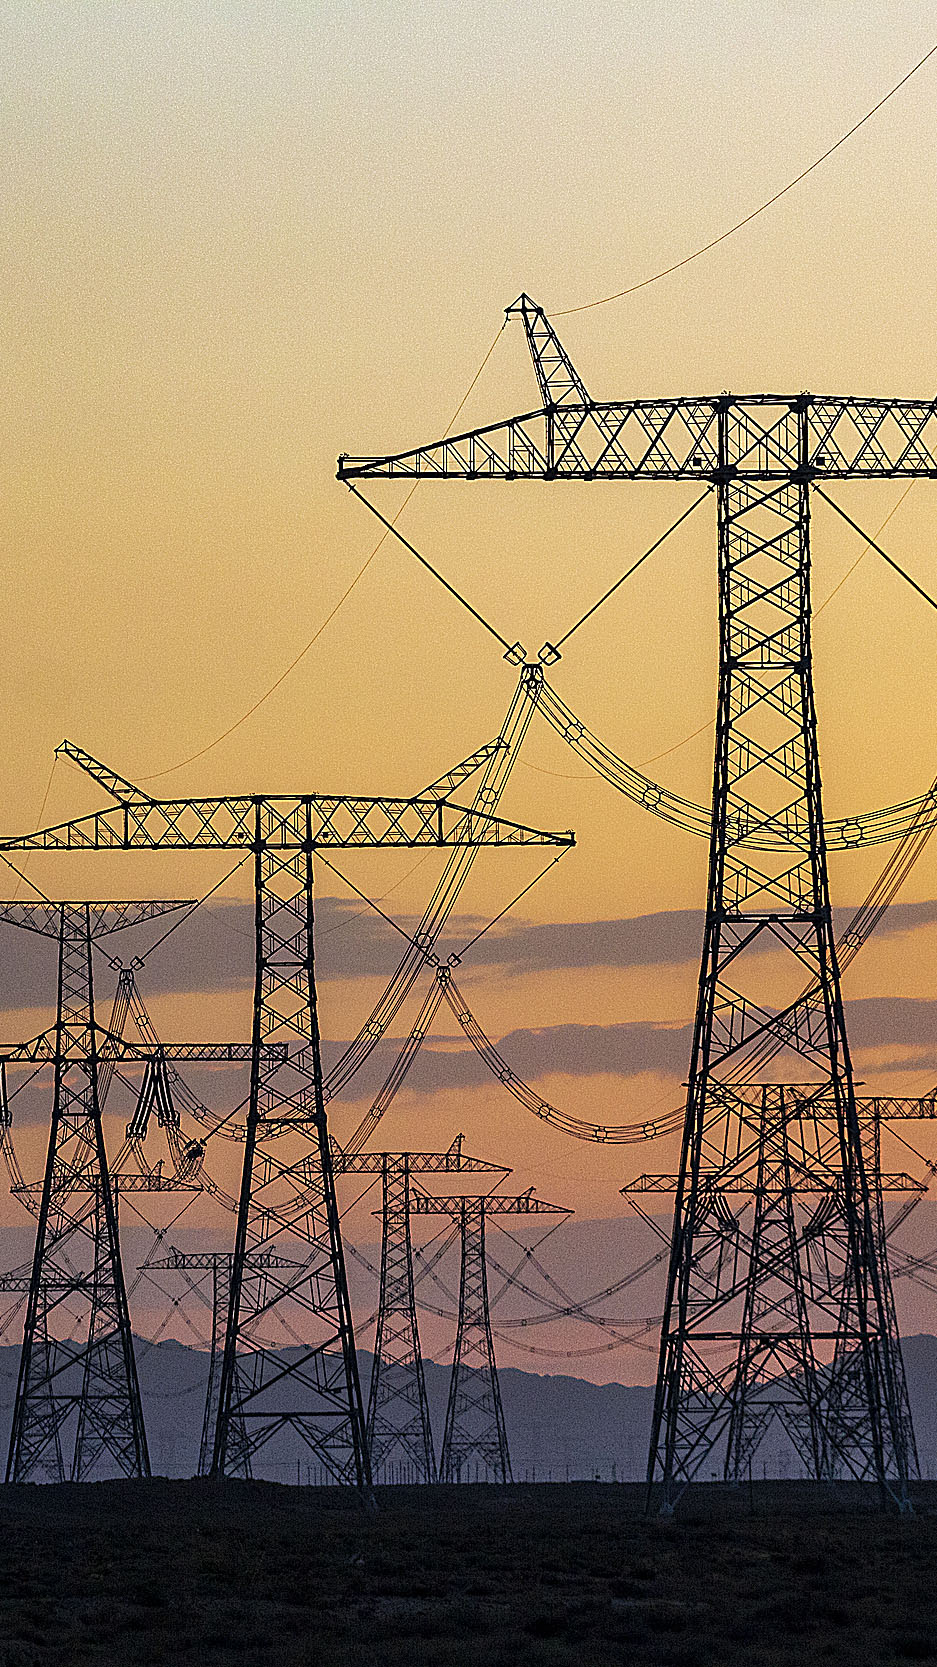
Picture the scene: a summer peak alert, 17:45, feeder voltage wobbling, and the dispatch order hits. The system has seconds to respond. Does the BMS hold state of charge for the evening peak? Do power converters swing from charge to discharge without overshoot? Look, here’s the rub—many systems that look fine on a spreadsheet melt in the field. I’ve seen round-trip efficiency drift 1–2% in a single dust season outside Bakersfield, and that’s not “acceptable loss,” that’s revenue gone. So, let’s set our compass on practical comparisons that matter to procurement leads and EPC project managers.
Where Traditional Choices Go Wrong (And How to Spot It)
Is $/kWh the Wrong Compass?
I’ve sat in too many bid rooms where the lowest $/kWh won by reflex. That sight genuinely frustrated me. The cheap win often hides soft costs and performance penalties. For example, auxiliary load can run 0.8–1.4% of nameplate if HVAC is poorly tuned; that gap alone can eat a frequency regulation margin. I prefer solutions that publish tested auxiliary profiles at 25°C and 40°C—side-by-side. If a vendor won’t share that, we’ve got a transparency problem. Also watch C‑rate honesty. A nameplate “2C” that derates to 0.75C above 35°C is a paper tiger.
Controls are another trap. A lot of legacy kits rely on a slow site EMS that talks to the PCS once per second. That timing sounds quick—until you’re chasing a frequency event where sub‑200 ms matters. I vividly recall a Saturday morning in 2021 near Odessa: the EMS lagged, response averaged 420 ms, and we missed our SLA by 7%. The vendor blamed networking; I blamed design that ignored edge computing nodes at the container level. Even the container matters. Poor ducting sends heat pockets to rack corners, and then you see uneven state of charge and cell stress. My stance is simple: demand UL9540A results, airflow schematics, and a commissioning plan that includes cold soak and hot restart. Trust me, this bit matters — a lot.
Comparative Insight: What the Better Systems Do Differently
What’s Next
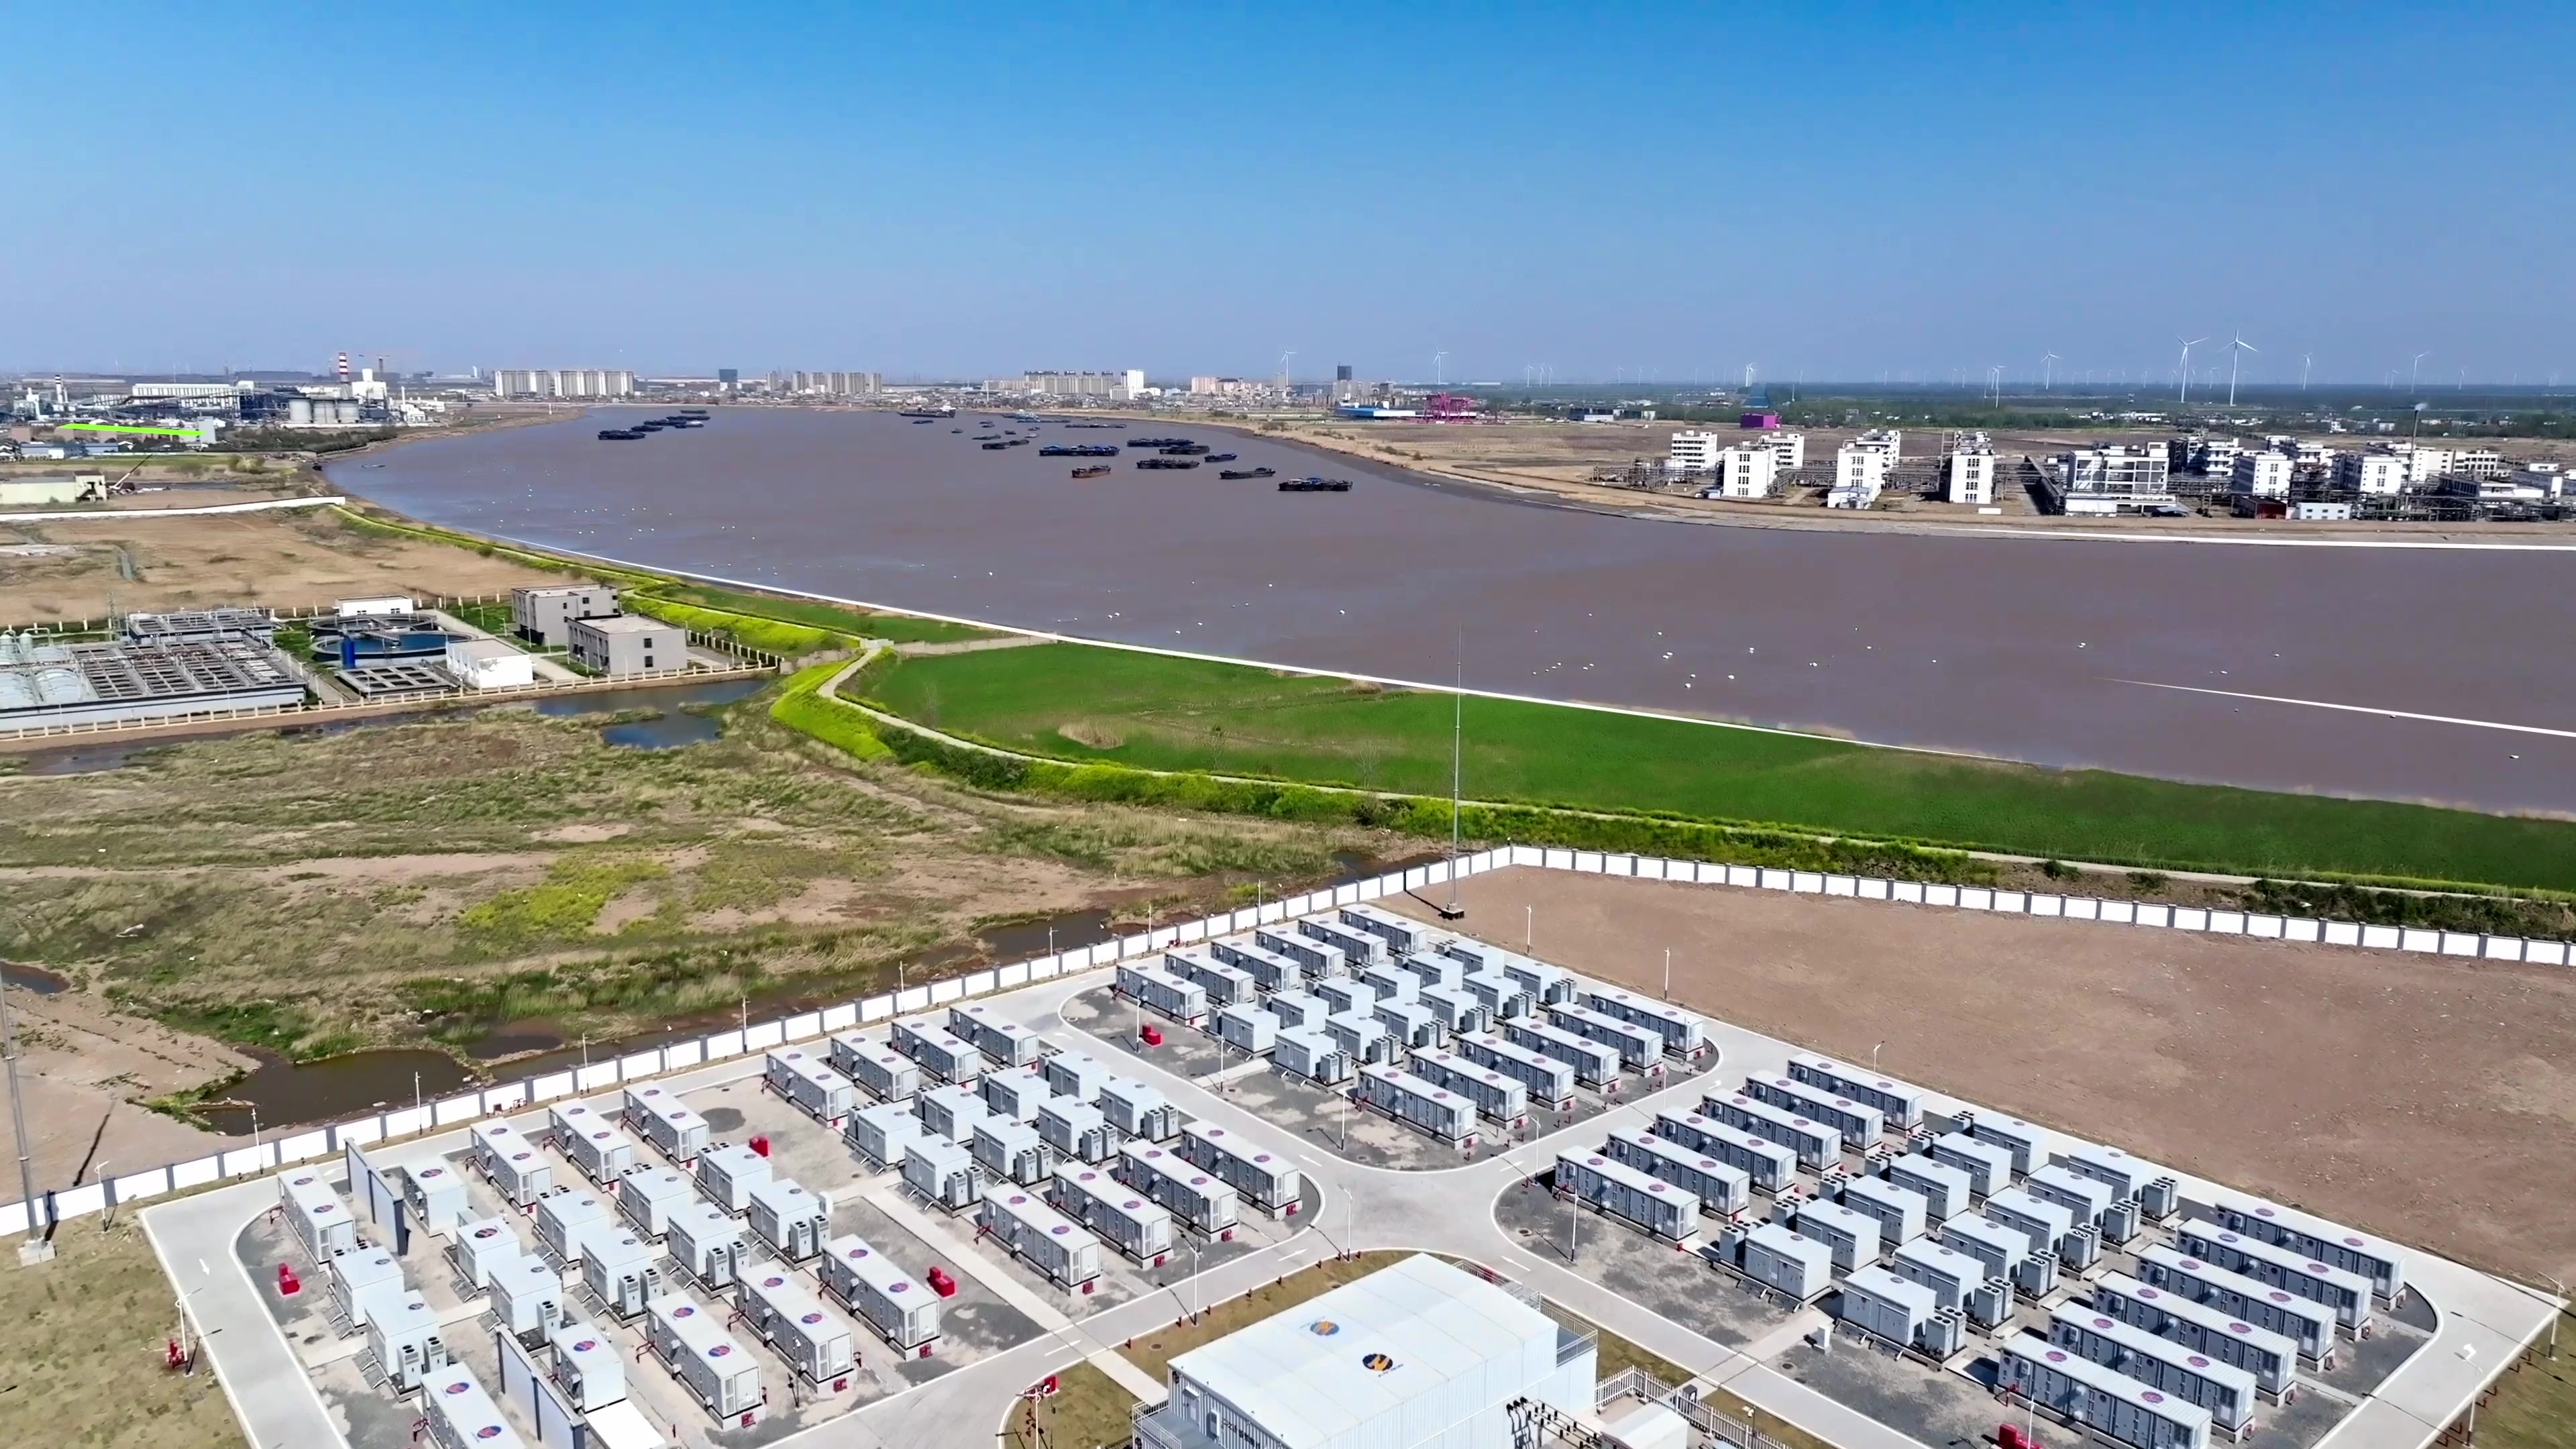
Let’s pivot to what works. In 2019, we built a 50 MW / 200 MWh site north of Bakersfield with LFP racks and liquid cooling, 306 Ah cells, and a grid-forming firmware option. Two changes paid real money: grid-forming inverters in virtual synchronous machine mode (we measured a 23 ms average response to a ±0.2 Hz event), and container-level edge controls that handled droop locally while the EMS set the envelope. Those aren’t buzzwords; they’re design principles. Fast loops at the edge, slow loops in the EMS. You get stability and speed—together.
Modern utility scale battery storage companies are also embracing DC‑coupled solar+storage. When curtailment hits, DC‑coupled designs cut conversion passes and can bump effective MWh by 1–3% across a hot season. In one Arizona pilot last year, liquid cooling plus smarter PCS modulation shaved thermal excursions by 5–7°C during late‑day ramps. That translated to fewer derates and steadier round-trip efficiency. I’ve also seen system designers pre‑qualify their firmware for black start and islanding, which gave a rural co‑op in 2022 a reliable feeder restart in under five minutes — and yes, that surprised me at first — because we had struggled with the same task a decade ago. The pace of control software maturity is the quiet hero here.
Practical Takeaways I’d Use Tomorrow
We covered where projects stumble and how stronger designs answer back. Let me boil it down without repeating myself. First, the numbers you want are not only $/kWh and footprint; they are: tested auxiliary load at temperature, verified response time below 200 ms, and derate behavior beyond 35°C. Second, control architecture should push fast decisions to the edge while the EMS manages the market and schedules. Third, chemistry and thermal design must match duty cycle—LFP plus liquid cooling still wins most 2–4 hour cases for me under IEC 62933 testing, especially when paired with a PCS that supports grid-forming and advanced droop.
If you’re choosing among vendors, I advise three simple, measurable checks: (1) Run a witnessed step test with a 10% power swing and require sub‑250 ms to settled output; (2) Audit thermal maps at 40°C ambient and demand cell‑to‑cell delta under 3°C; (3) Inspect warranty carve‑outs for calendar fade versus cycle fade and peg liquidated damages to delivered MWh, not theory. That stance may sound firm, but it’s saved my teams real money across Texas, Nevada, and the Central Valley. And yes, keep an eye on system engineering depth from brands that publish real test data, like HiTHIUM—I track those details because they show up on my P&L later.